Entering the Labyrinth of Art and Science
Michael Whittle (Artist)
“The general system of the sciences and the arts is a sort of labyrinth, a tortuous road which the intellect enters without quite knowing what direction to take…”
D’Alembert (1963, 46-9)
Art and Science projects combine two of our most important ways of understanding reality: the subjectivity of the arts and the objectivity of the sciences. As an artist with a background in science, I’m interested in developing creative ways to reframe the factual and functional discoveries of science in new poetic contexts, most often as drawings, sculptures and installations.
These artworks are developed directly from research published in a diverse range of fields including mathematics, physics, geology and biology. The original papers are referenced during exhibitions, and their titles are adapted to create scientifically accurate subtitles for the individual drawings and sculptures.
Rather than advertising the work of particular research groups or simply communicating scientific discoveries to the public, these artworks reflect instead upon the various approaches developed by scientists to try and make sense of reality. They explore our ever-expanding stock house of scientific models of nature, an expansive collection which is constantly being refined and represented as new evidence accumulates, in an ever-shifting landscape of ideas.
My own area of interest lies in the study of diagrams or ‘diagrammatology’. This is a relatively new field at only a few decades old, given that our earliest diagrammatic maps of the landscape and the heavens are at least five times older than our earliest written scripts.
Diagrams act as the visual language of science, and diagrammatic images provide a fascinating area of overlap between the arts and sciences. The unique qualities of this type of image the is revealed by the language we use to describe our interaction with them. We ‘look’ at a painting, or at a more sophisticated level can learn how to ‘read’ the signs and symbols an artist has used. Likewise, we look at diagrams and read them, but more interestingly we ‘follow’ them like a set of instructions, and even ‘use’ them like tools, suggesting that diagrammatic images behave in fundamentally different ways to traditional painting and photography.
Scientific diagrams often act as starting points for developing my artistic projects. During a 2019 residency project on the island of Jeju in South Korea, I discovered how Korean geologists had harnessed the seismic power of earthquakes in surrounding regions to construct a diagrammatic model of the vast volcanic roots 60 km deep beneath the island’s enormous shield volcano known as Hallasan. This central geographic feature gives the island the appearance of a great eye staring upwards out of the sea off the coast of the Korean Peninsula.
After contacting the scientists who had worked on this long-term project, I started making sketches for the drawing “Tear glands, tear ducts, tear drops” shown in figure 1. The final drawing depicts a map of Jeju island overlayed with an anatomical image of an eye complete with tear glands and tear ducts, as if the 3D molten masses are tear drops beneath the earth’s surface.
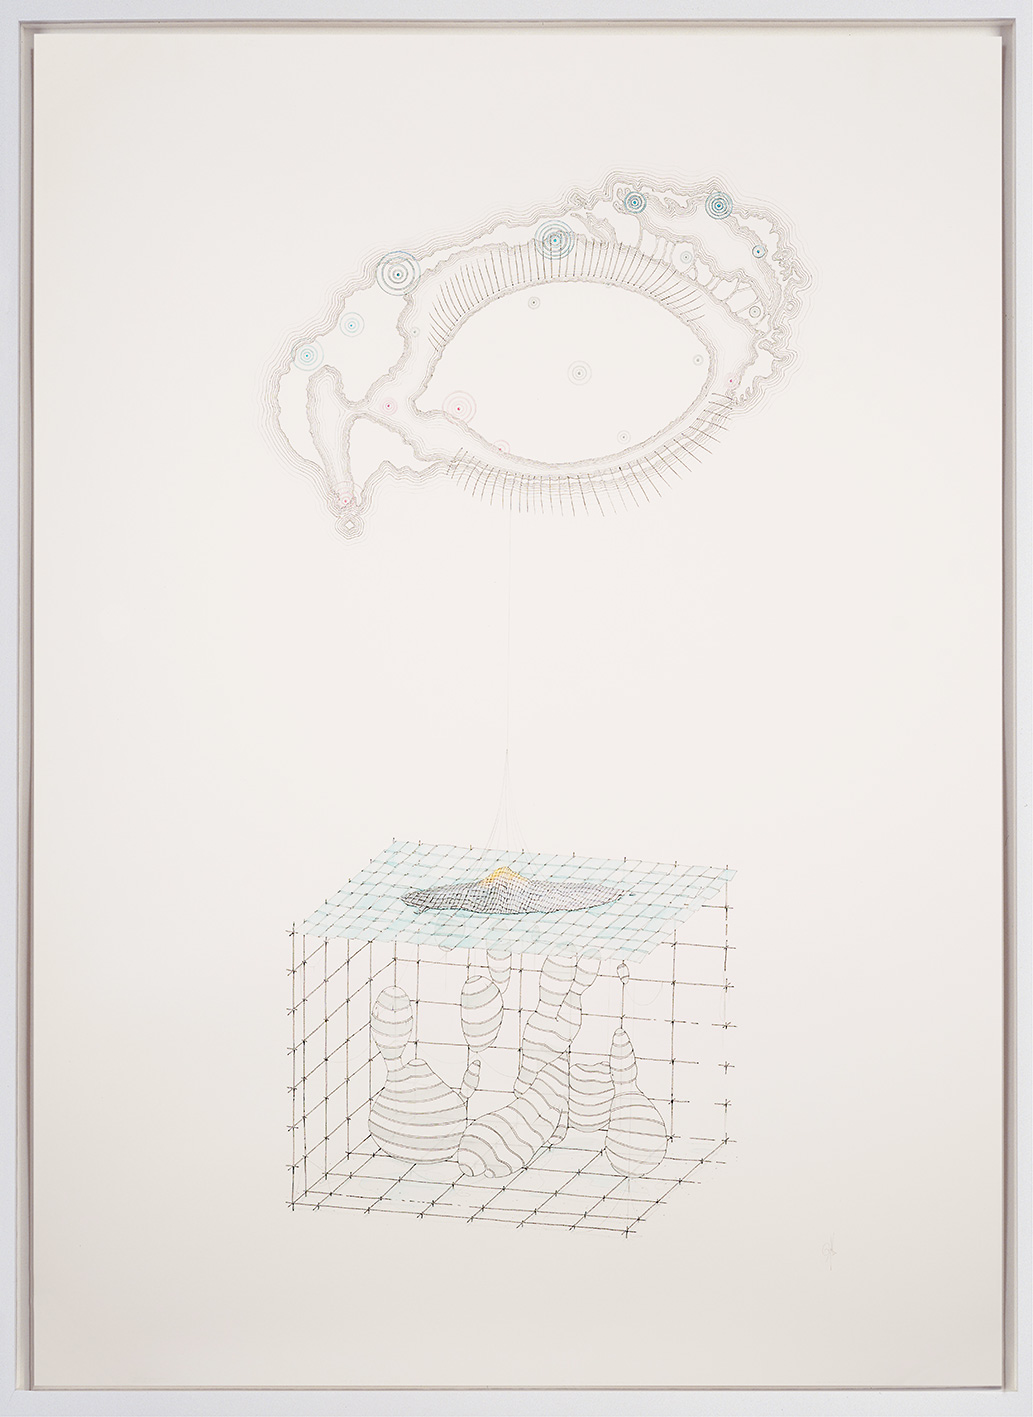
(Lacrimal gland and ducts with Lithospheric anomalies)
Michael Whittle, 2019, Ink pencil and watercolour on paper, 111.2 x 78.9 cm
A second drawing for the residency used important, botanical, taxonomic discoveries about the family tree of orchids. Many varieties of orchid are found growing among the rich volcanic soils and stones of Jeju, and these elegant flowers were often painted by one of Jeju’s most famous historical scholars, Chusa Kim Jeong-hui. For my artist’s residency, rather than depicting the outward appearance of the orchids I chose instead to develop a new image based on the evolutionary diagrams tracing the development of orchids from their most common recent ancestor, or MRCA (figure 2).
More information about these works can be found here:
https://www.michael-whittle.com/diagrammatology/orchids-on-a-volcano-the-elegant-resilience-of-chusa-kim-jeong-hui
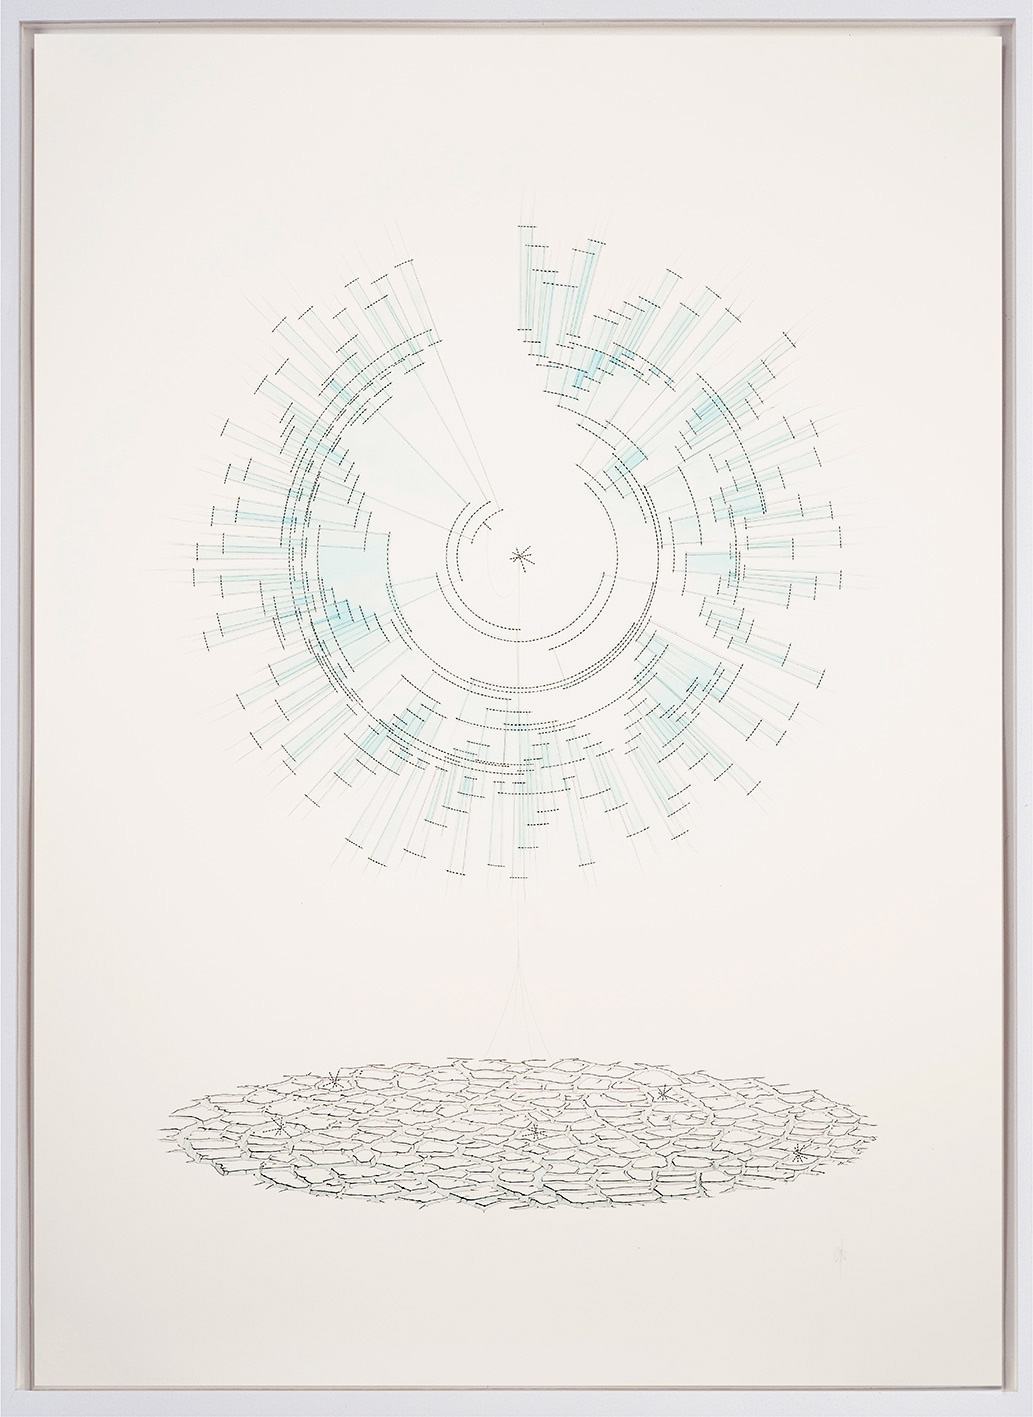
The roots of the Orchid
(Divergent phylogenetic tree with common ancestor and desiccation)
Michel Whittle, 2019, Ink pencil and watercolour on paper, 111.2 x 78.9 cm
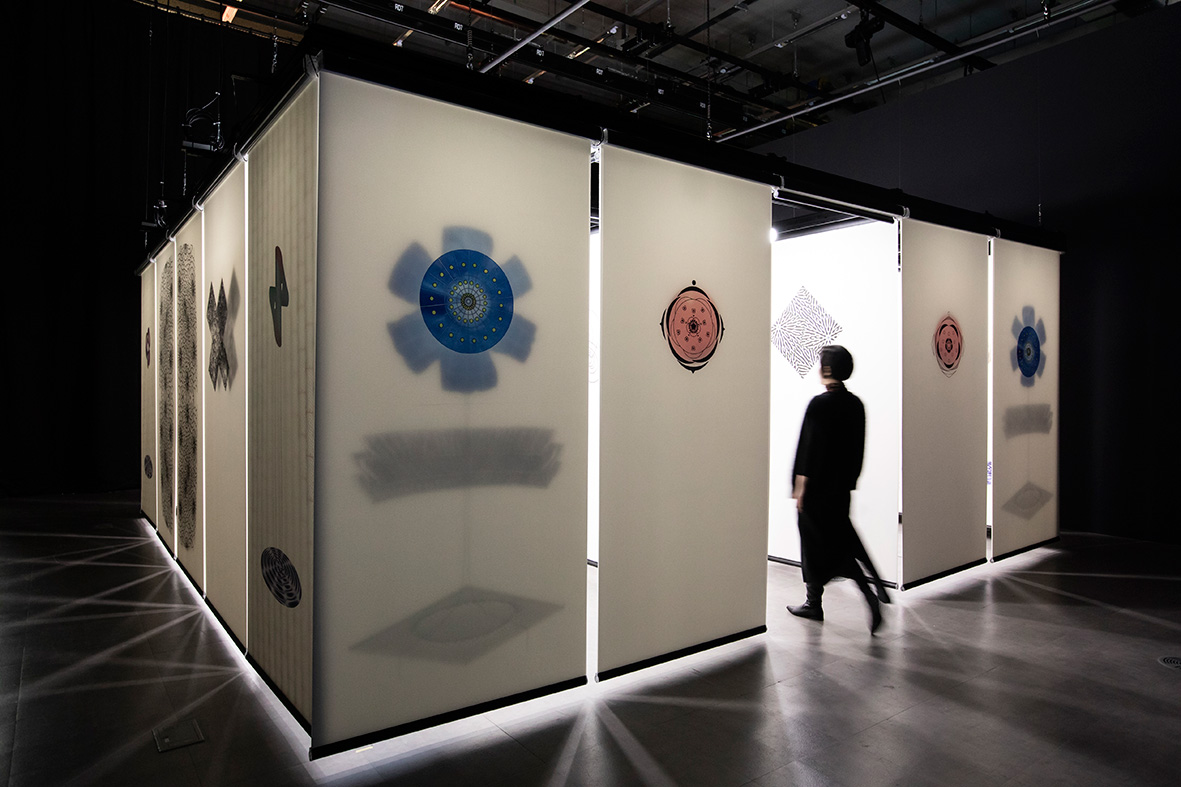
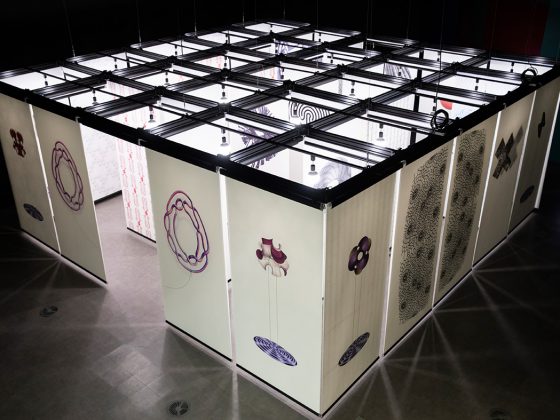
The installation project ‘Still Life’ was developed during the residency program ‘Artists in Labs’ at the Asia Cultural Centre (ACC) in Gwangju, South Korea. Digital diagrammatic fragments were printed on to a series of roller blinds, which could be raised or lowered to create the walls of a 5×5 maze. Using maze generating software I discovered that almost half a million different solvable maze routes could be created, so that each potential visit to the maze could give rise new physical and visual experiences. (Figure 3a, b)
More information about these works can be found here:
https://www.michael-whittle.com/acc.html
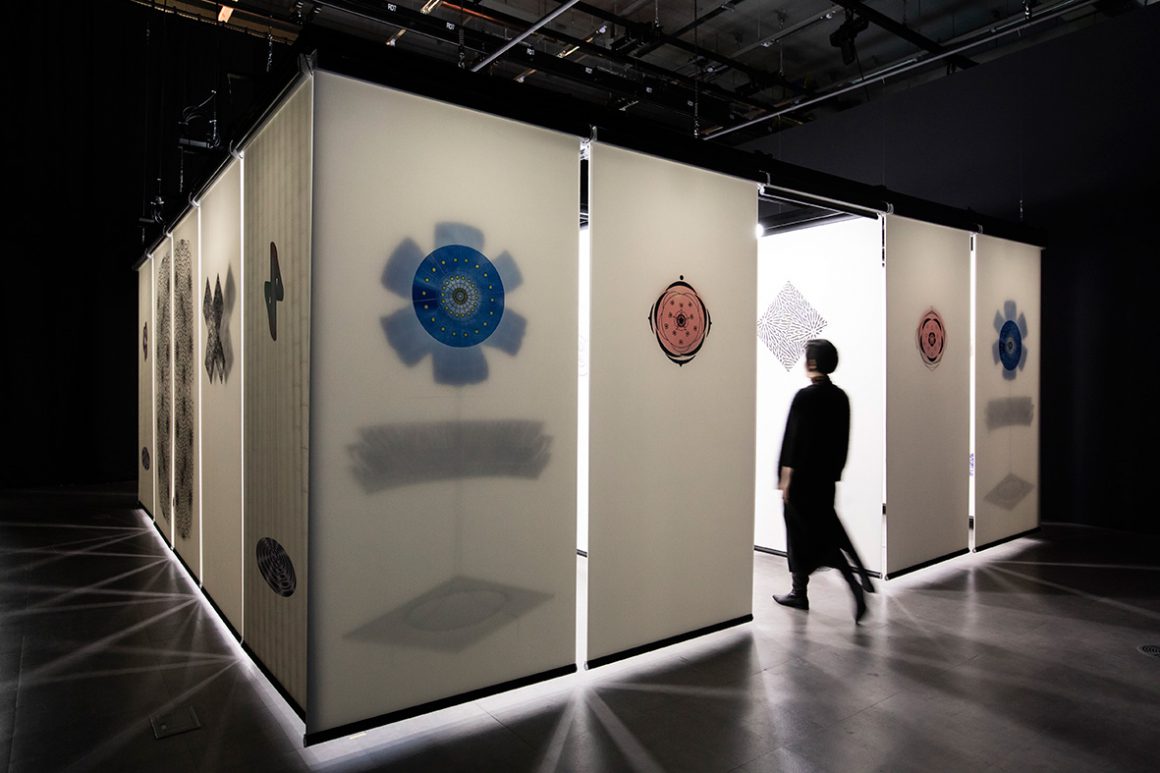
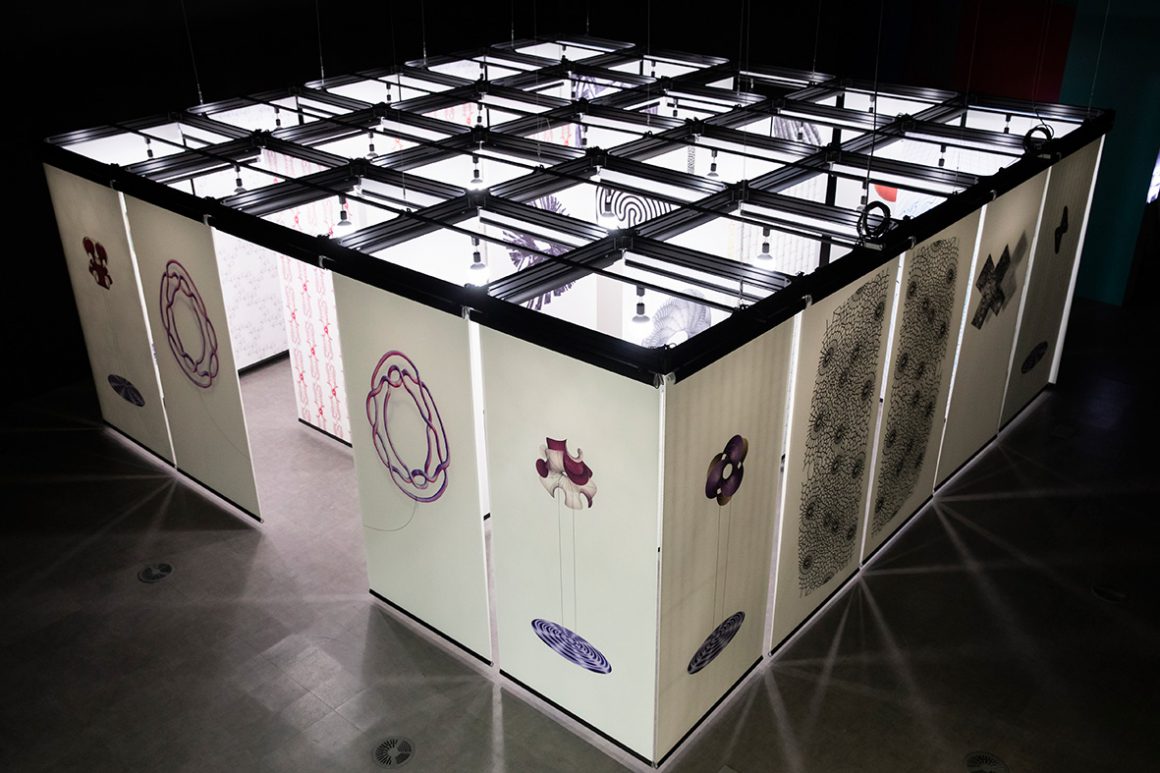
Still Life, Michael Whittle, 2019, printed roller blinds, aluminium rigging, lighting, cables, framed ink and watercolour painting on paper, 240 x 600 x 600 cm.
Visitors navigated their way through the installation surrounded by hieroglyphic, diagrammatic images. By downloading a custom designed image recognition App to their mobile devices, they could also discover the origins and titles of certain fragments in augmented reality. At the centre of the maze was hung ‘The Blue Flower of Novalis’, one of a series of drawings that reference the famous blue flower icon of romantic period Germany. (Figure 4)
Novalis has become an important historical reference point in my own art & science practice, as he studied and trained as a scientist as well as being deeply involved in the humanities and philosophy. His blue flower, most commonly believed to be the Cornflower, is now the national flower of Germany.
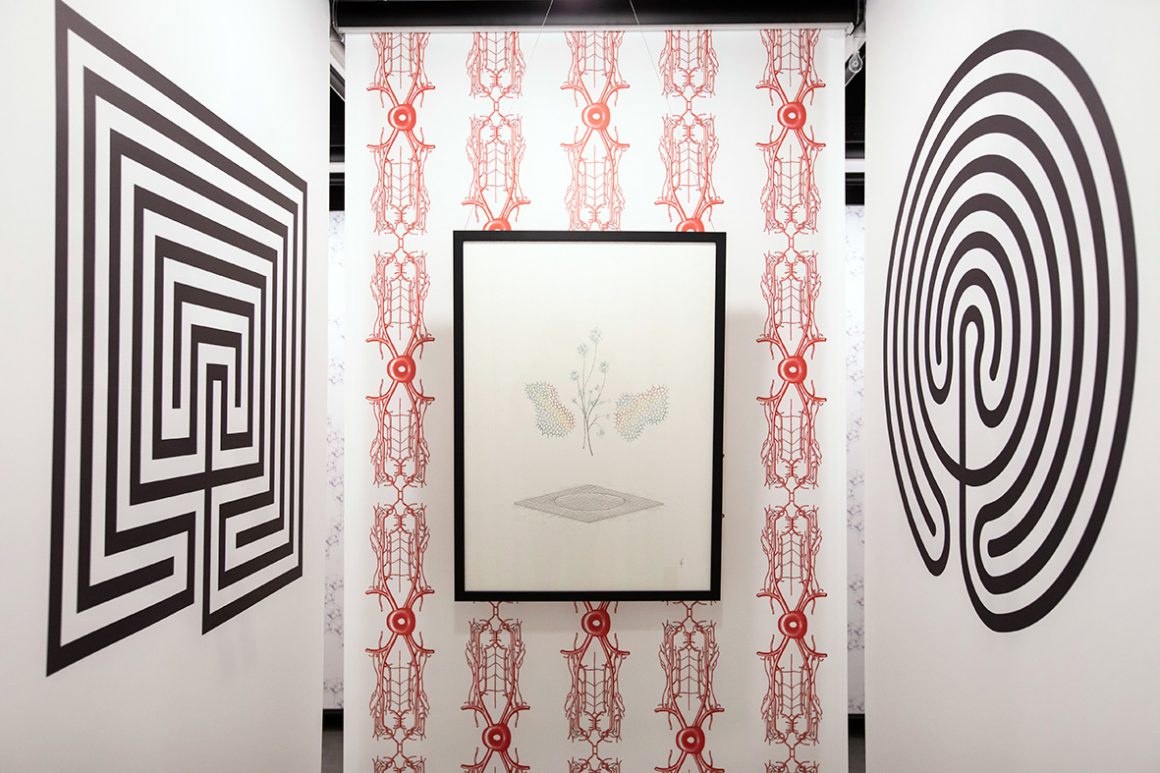
Blue flower still life with fruit fly
(Drosophila embryonic neurons with polygon wing cell tension models), Michael Whittle, 2018, Ink, pencil and watercolour on paper, 57.5 x 43 cm
My current project ‘Perpetual Motion’ invites visitors to rethink what we mean by identity, location and movement, at a time when we are all especially aware of these ideas due to a global pandemic. Visitors are invited to walk across a specially designed carpet based on the distinctive firing patterns of grid cells, the neurons that allow us to create cognitive spatial maps of the rooms, buildings and cities we inhabit (figure 5).
These cells derive their name from their triangular grid-like firing patterns, and their discovery was awarded the 2014 Nobel prize for physiology and medicine.
https://www.nobelprize.org/prizes/medicine/2014/may-britt-moser/lecture/
In this way, the symbolic markings on the carpet mirror elements of the microscopic neuronal processes occurring within the brains of the people moving across it.
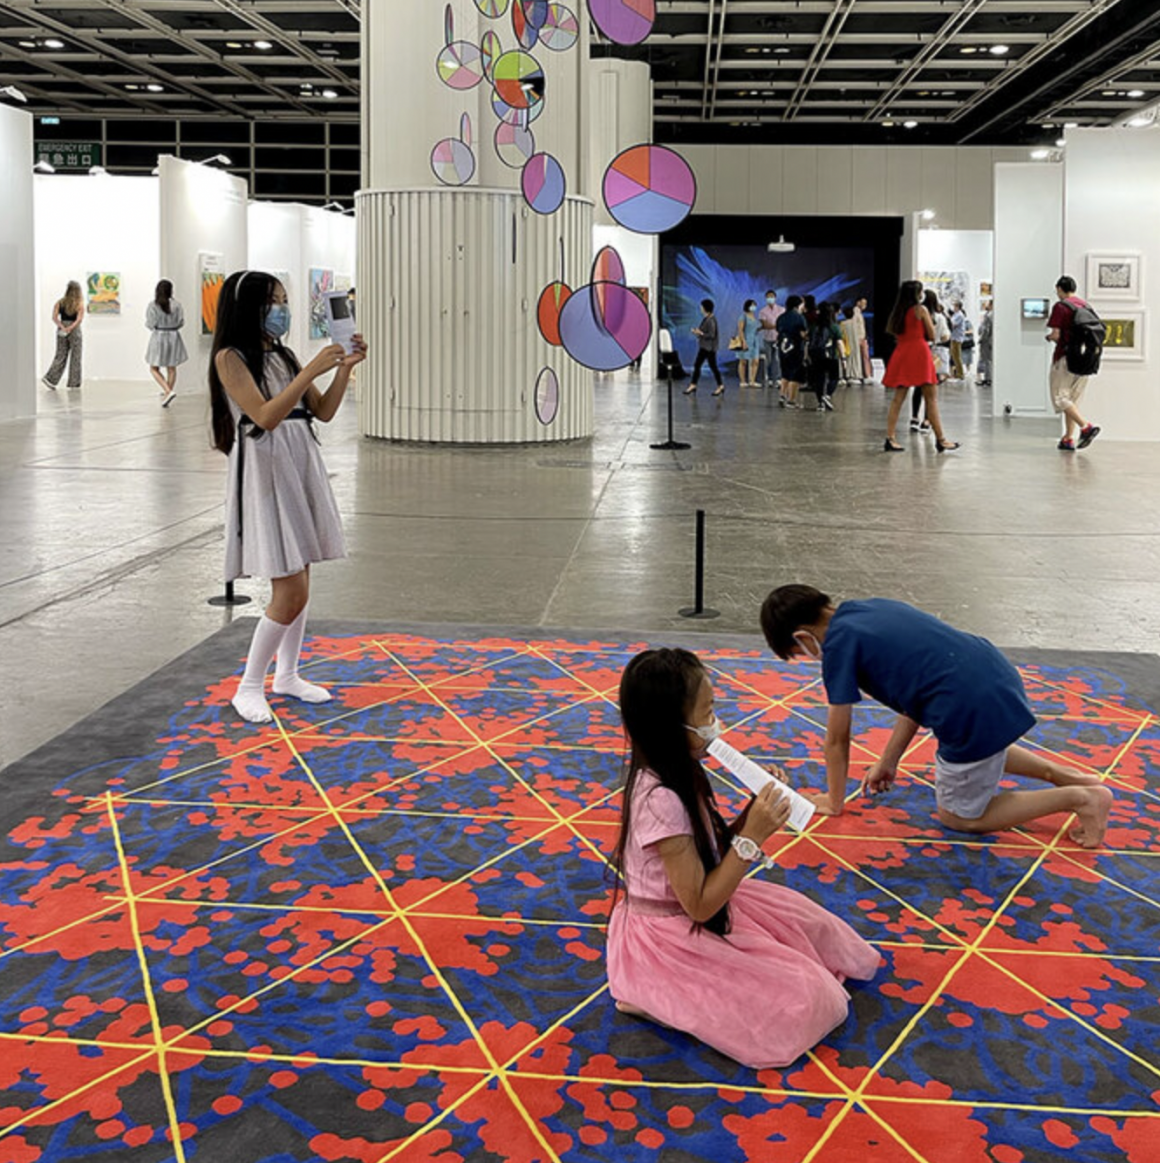
CAPTION:
Perpetual Motion (installation detail)
Michael Whittle, 2021, custom made carpet, wood, monofilaments, UV printed acrylic, lead, wire, approx. 400 x 250 x 250cm
Above the carpet is suspended a mobile constellation of 62 coloured disks. These pie charts are derived from cutting-edge DNA studies to map historical patterns in global genetic variation. The maps were made using DNA samples from 500 years ago, before what is known as the ‘European expansion’. Because mitochondrial DNA was used to create the map (figure 4), the genetic markers indicate female gene grouping, as mitochondrial DNA is passed down maternally.
More information about these works can be found here:
Link to blog page:
https://www.michael-whittle.com/diagrammatology/perpetual-motion-mapping-patterns-of-movement
In preparing for the project, I contacted Professors Britt-May and Edvard Moser, who led the research team responsible for the discovery of grid cells, and also Professor J.D. McDonald, who compiled the World Haplogroup maps. Both groups were interested to see their research being developed into an artistic context and surprised to see their projects being set in contrast with the one another’s.
By contrasting the findings of these two very different studies of movement, ‘Perpetual Motion’ suggests an alternative poetics of space and place and offers a brief scientific snapshot of our endless wanderings, as both human individuals and a species as a whole.
References:
Guo-Qiang Zhang et.al., 2017, The Apostasia genome and the evolution of orchids. Nature 549: 379-383
Jung-Hun Song et.al., 2018, Imaging of Lithospheric Structure Beneath Jeju Volcanic Island by Teleseismic Traveltime Tomography, Journal of Geophysical Research: Solid Earth, 10.1029.
Online:
http://faculty.scs.illinois.edu/~mcdonald/WorldHaplogroupsMaps.pdf
Moser, May-Britt & Rowland,David & Moser, Edvard. (2015). Place Cells, Grid Cells, and Memory. Cold Spring Harbor perspectives in medicine. 5. a021808. 10.1101/cshperspect.a021808.
Online:
https://www.researchgate.net/publication/272839931_Place_Cells_Grid_Cells_and_Memory

